Close Menu
My Forex View

    Subscribe to Updates

    Get the latest creative news from FooBar about art, design and business.

    Please enable JavaScript in your browser to complete this form.
    Loading
    What's Hot

    Technical Analysis – USDJPY tests 158.00 level for first time in five months

    December 27, 2024

    Daily Comment – Soft PCE inflation keeps rate cut hopes alive, but markets stay cautious

    December 23, 2024

    Technical Analysis – Gold returns above uptrend line

    December 23, 2024
    Facebook X (Twitter) Instagram
    • Live Market
    • Learn Forex Trading
    • Technical Analysis
    Facebook X (Twitter) Instagram Pinterest Vimeo
    My Forex ViewMy Forex View
    • Home
    • Live Market
      • GBPUSD
      • EURUSD
      • USDJPY
      • XAUUSD
      • All Currency Pair
      • All Commodities Pair
    • Analysis
    • Free Forex Signals
    • Education
    • Tools
      • Economic Calendar
      • Currency Converter
      • Risk of Ruin Calculator
      • Pivot Points Calculator
      • Crypto Exchange Fees Calculator
      • Fibonacci Calculator
      • Forex Rebates
      • Margin Calculator
      • Compounding Calculator
      • Profit Calculator
      • Pip Calculator
      • Lot Size Calculator
      • Drawdown Calculator
    • Blog
    Join Telegram
    My Forex View
    Home » Technical Analysis – USDCHF looks promising ahead of US CPI data
    Technical Analysis

    Technical Analysis – USDCHF looks promising ahead of US CPI data

    Christina ParthenidouBy Christina ParthenidouOctober 10, 2024Updated:November 7, 2024No Comments2 Mins Read
    Facebook Twitter LinkedIn Pinterest Email
    • USDCHF finds fresh buying near 50-day SMA; rises to a six-week high
    • The short-term outlook remains positive, but a pullback cannot be ruled out
    • US CPI inflation data may create fresh volatility at 12:30 GMT

    USDCHF secured strong footing near the 50-day simple moving average (SMA) and extended its bullish break out of the monthly range to a six-week high of 0.8609 on Wednesday.

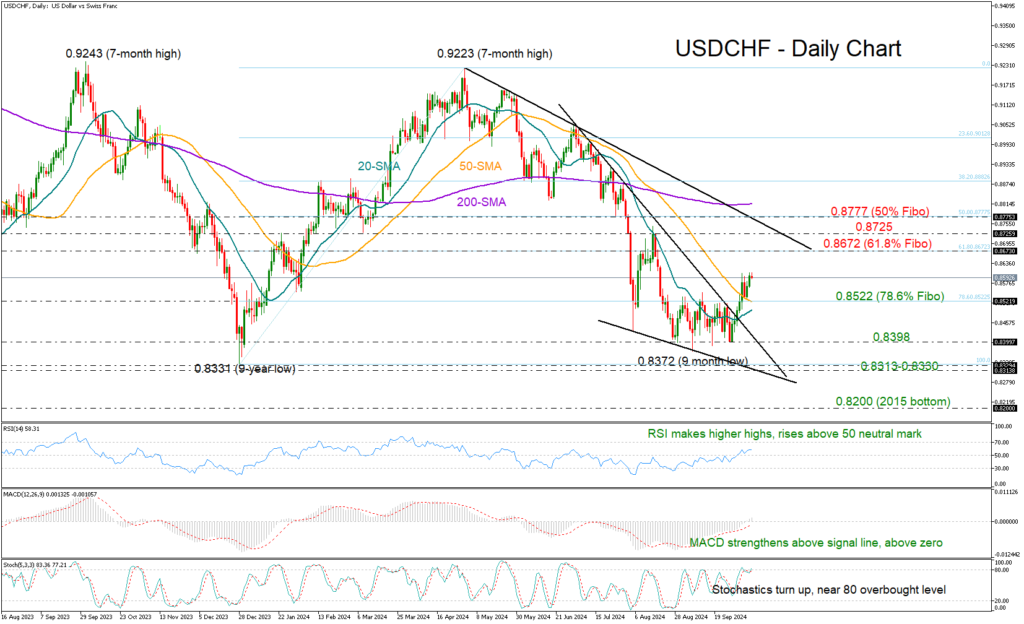
    Despite the current weak price momentum, the technical indicators suggest there could be more bullish potential. With the RSI extending its uptrend above its 50 neutral mark and the MACD entering the positive region for the first time since May, the short-term bias is now favoring the upside. Yet, with the stochastic oscillator hovering near its 80 overbought level, some stability cannot be ruled out.

    Resistance is anticipated around the 61.8% Fibonacci retracement level of 0.8672 if the pair continues its bullish wave. Further up, the August bar of 0.8725 could keep the bulls busy, delaying any increases towards the descending trendline and the 50% Fibonacci mark of 0.8777.

    On the downside, the positive bias could be maintained if the 78.6% Fibonacci level of 0.8522 and the 50-day SMA put a floor under the price. If they concede and the price dips below its 20-day SMA, the spotlight will turn straight to the 0.8398 bottom. A steeper decline may threaten a broad outlook deterioration below the nine-year low of 0.8330 and the 0.8313 barrier. The 0.8200 round mark could come on the radar next.

    All in all, USDCHF seems to have a bullish bias in the short-term after exiting its recent horizontal trajectory. Unless the price tumbles below 0.8522, a bearish action shouldn’t be a concern.

    Source by: XM Global

    Share. Facebook Twitter Pinterest LinkedIn Telegram WhatsApp Copy Link
    Previous ArticleDaily Comment – Dollar seeks direction amidst tepid market conditions
    Next Article Midweek Technical Look – EURUSD, USDCAD, gold

    Related Posts

    Technical Analysis

    Technical Analysis – USDJPY tests 158.00 level for first time in five months

    December 27, 2024
    Gold

    Technical Analysis – Gold returns above uptrend line

    December 23, 2024
    Technical Analysis

    Technical Analysis – USDCHF bulls are back and want to stay

    December 13, 2024
    Top Posts

    Get a Free Xmaster Formula Indicator Forex for MT4

    July 30, 2024102 Views

    Technical Analysis – ETHUSD trades flat after ETF debut

    July 25, 202446 Views

    Traders Dynamic Index (TDI): Best Strategies and Settings

    August 16, 202438 Views
    Stay In Touch
    • Facebook
    • YouTube
    • TikTok
    • WhatsApp
    • Twitter
    • Instagram

    Subscribe to Updates

    Get the latest tech news from FooBar about tech, design and biz.

    Most Popular

    Get a Free Xmaster Formula Indicator Forex for MT4

    July 30, 2024102 Views

    Technical Analysis – ETHUSD trades flat after ETF debut

    July 25, 202446 Views

    Traders Dynamic Index (TDI): Best Strategies and Settings

    August 16, 202438 Views
    Our Picks

    Technical Analysis – USDJPY tests 158.00 level for first time in five months

    December 27, 2024

    Daily Comment – Soft PCE inflation keeps rate cut hopes alive, but markets stay cautious

    December 23, 2024

    Technical Analysis – Gold returns above uptrend line

    December 23, 2024

    Subscribe to Updates

    Get the latest creative news from FooBar about art, design and business.

    Please enable JavaScript in your browser to complete this form.
    Loading
    © 2025 MyForexView.
    • Home
    • Analysis
    • Economic Calendar

    Type above and press Enter to search. Press Esc to cancel.