Close Menu
My Forex View

    Subscribe to Updates

    Get the latest creative news from FooBar about art, design and business.

    Please enable JavaScript in your browser to complete this form.
    Loading
    What's Hot

    Technical Analysis – USDJPY tests 158.00 level for first time in five months

    December 27, 2024

    Daily Comment – Soft PCE inflation keeps rate cut hopes alive, but markets stay cautious

    December 23, 2024

    Technical Analysis – Gold returns above uptrend line

    December 23, 2024
    Facebook X (Twitter) Instagram
    • Live Market
    • Learn Forex Trading
    • Technical Analysis
    Facebook X (Twitter) Instagram Pinterest Vimeo
    My Forex ViewMy Forex View
    • Home
    • Live Market
      • GBPUSD
      • EURUSD
      • USDJPY
      • XAUUSD
      • All Currency Pair
      • All Commodities Pair
    • Analysis
    • Free Forex Signals
    • Education
    • Tools
      • Economic Calendar
      • Currency Converter
      • Risk of Ruin Calculator
      • Pivot Points Calculator
      • Crypto Exchange Fees Calculator
      • Fibonacci Calculator
      • Forex Rebates
      • Margin Calculator
      • Compounding Calculator
      • Profit Calculator
      • Pip Calculator
      • Lot Size Calculator
      • Drawdown Calculator
    • Blog
    Join Telegram
    My Forex View
    Home » Technical Analysis – USDJPY cheers as Trump leads election race
    Technical Analysis

    Technical Analysis – USDJPY cheers as Trump leads election race

    Christina ParthenidouBy Christina ParthenidouNovember 6, 2024Updated:November 7, 2024No Comments2 Mins Read
    Facebook Twitter LinkedIn Pinterest Email
    • USDJPY hits fresh highs as Trump wins battleground states
    • Resistance of 153.80-154.00 still in play

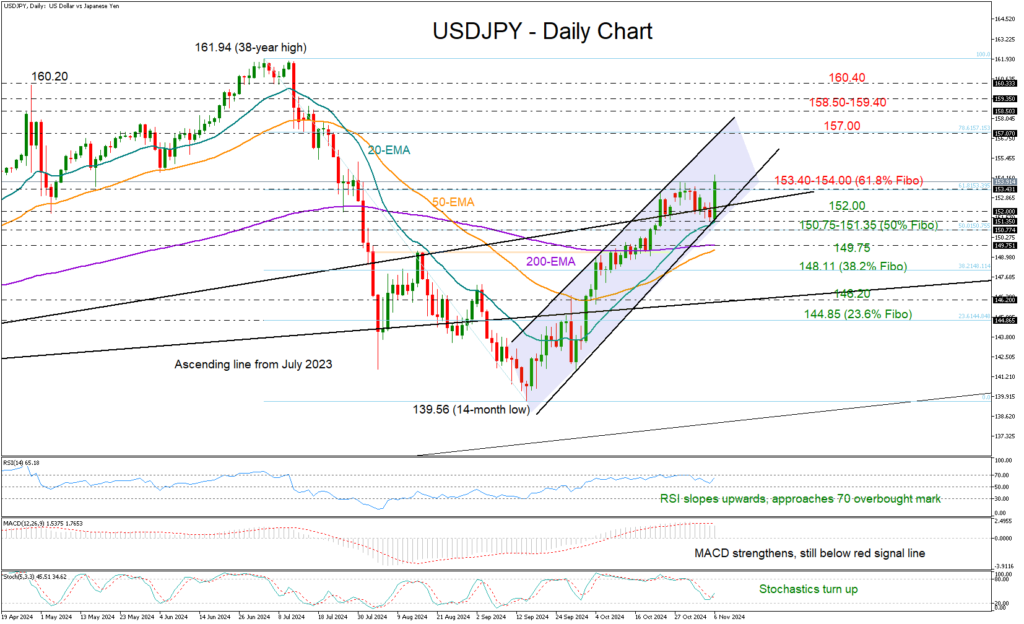
    USDJPY soared to a new three-month high of 154.36 as Donald Trump won Pennsylvania, Georgia, and North Carolina. Technically, the pair found solid support near its 20-day exponential moving average (EMA), keeping its upward trend in safe place.

    That said, the day is not over yet, and the 153.40-154.00 barrier is still under examination. The short-term bias is skewed to the upside according to the technical indicators, though with the RSI moving closer to its 70 overbought level, we can’t rule out a pullback unless the price successfully closes above 154.00. In this case the price could rocket towards the 157.00 number, which coincides with the 78.6% Fibonacci retracement of the previous downleg and the upper band of the bullish channel. The 158.50-159.40 area could be the next challenge before the door opens for the 1990 top of 160.40.

    Should the bears retake control, traders may focus on the 152.00 number, where the lower boundary of the bullish channel is positioned. The 20-day EMA at 151.35 will be closely watched too along with the 50% Fibonacci of 150.75, a break of which could confirm a downside reversal. If the 200- and 50-day EMAs at 149.75 give way as well, then the sell-off could intensify toward the 38.2% Fibonacci of 148.11. Even lower, the pair may face stability near 146.20.

    In a nutshell, the latest advance in USDJPY improved the upside potential, though for the rally to hold, the bulls should successfully breach the wall around 154.00.

    Source by: XM Global

    Share. Facebook Twitter Pinterest LinkedIn Telegram WhatsApp Copy Link
    Previous ArticleTechnical Analysis – US 30 index skyrockets after Trump’s victory
    Next Article Technical Analysis – AUDUSD sells off, but outlook is cloudy

    Related Posts

    Technical Analysis

    Technical Analysis – USDJPY tests 158.00 level for first time in five months

    December 27, 2024
    Gold

    Technical Analysis – Gold returns above uptrend line

    December 23, 2024
    Technical Analysis

    Technical Analysis – USDCHF bulls are back and want to stay

    December 13, 2024
    Top Posts

    Get a Free Xmaster Formula Indicator Forex for MT4

    July 30, 2024102 Views

    Technical Analysis – ETHUSD trades flat after ETF debut

    July 25, 202446 Views

    Traders Dynamic Index (TDI): Best Strategies and Settings

    August 16, 202438 Views
    Stay In Touch
    • Facebook
    • YouTube
    • TikTok
    • WhatsApp
    • Twitter
    • Instagram

    Subscribe to Updates

    Get the latest tech news from FooBar about tech, design and biz.

    Most Popular

    Get a Free Xmaster Formula Indicator Forex for MT4

    July 30, 2024102 Views

    Technical Analysis – ETHUSD trades flat after ETF debut

    July 25, 202446 Views

    Traders Dynamic Index (TDI): Best Strategies and Settings

    August 16, 202438 Views
    Our Picks

    Technical Analysis – USDJPY tests 158.00 level for first time in five months

    December 27, 2024

    Daily Comment – Soft PCE inflation keeps rate cut hopes alive, but markets stay cautious

    December 23, 2024

    Technical Analysis – Gold returns above uptrend line

    December 23, 2024

    Subscribe to Updates

    Get the latest creative news from FooBar about art, design and business.

    Please enable JavaScript in your browser to complete this form.
    Loading
    © 2025 MyForexView.
    • Home
    • Analysis
    • Economic Calendar

    Type above and press Enter to search. Press Esc to cancel.