Close Menu
My Forex View

    Subscribe to Updates

    Get the latest creative news from FooBar about art, design and business.

    Please enable JavaScript in your browser to complete this form.
    Loading
    What's Hot

    Technical Analysis – USDJPY tests 158.00 level for first time in five months

    December 27, 2024

    Daily Comment – Soft PCE inflation keeps rate cut hopes alive, but markets stay cautious

    December 23, 2024

    Technical Analysis – Gold returns above uptrend line

    December 23, 2024
    Facebook X (Twitter) Instagram
    • Live Market
    • Learn Forex Trading
    • Technical Analysis
    Facebook X (Twitter) Instagram Pinterest Vimeo
    My Forex ViewMy Forex View
    • Home
    • Live Market
      • GBPUSD
      • EURUSD
      • USDJPY
      • XAUUSD
      • All Currency Pair
      • All Commodities Pair
    • Analysis
    • Free Forex Signals
    • Education
    • Tools
      • Economic Calendar
      • Currency Converter
      • Risk of Ruin Calculator
      • Pivot Points Calculator
      • Crypto Exchange Fees Calculator
      • Fibonacci Calculator
      • Forex Rebates
      • Margin Calculator
      • Compounding Calculator
      • Profit Calculator
      • Pip Calculator
      • Lot Size Calculator
      • Drawdown Calculator
    • Blog
    Join Telegram
    My Forex View
    Home » Technical Analysis – USDJPY faces a pass or fail test
    Technical Analysis

    Technical Analysis – USDJPY faces a pass or fail test

    Christina ParthenidouBy Christina ParthenidouOctober 16, 2024Updated:November 7, 2024No Comments2 Mins Read
    Facebook Twitter LinkedIn Pinterest Email
    • USDJPY extends consolidation around August’s bar
    • Technical signals weaken, cannot warrant a bullish trend reversal
    • US retail sales, jobless claims due on Thursday at 12:30 GMT

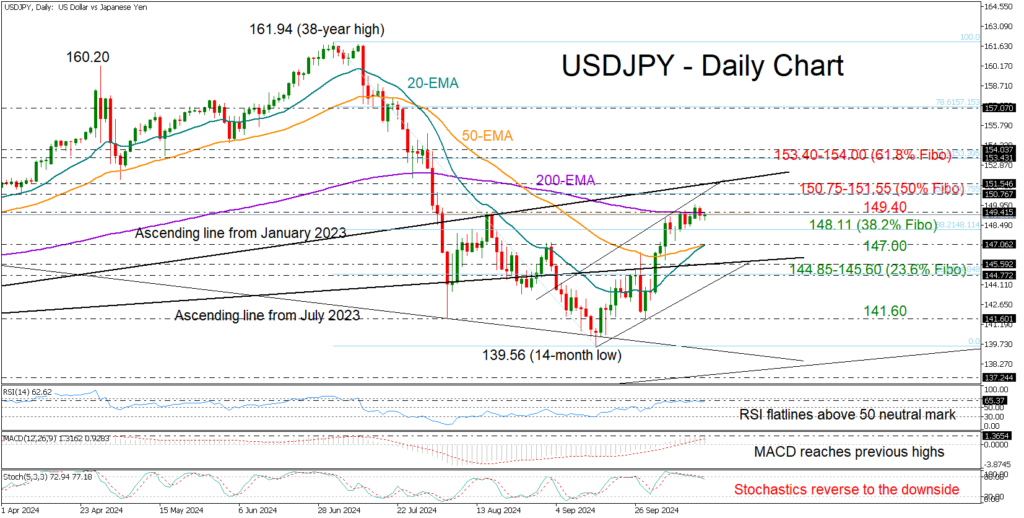
    USDJPY reached a two-month high of 149.96, but it couldn’t hold its strength above the 200-day exponential moving average (EMA) at 149.40 on Tuesday.

    Over the past few days, the pair has been struggling for a bullish breakout, leaving investors wondering whether it’s time for a negative pivot. The slowdown in the technical indicators reflects persisting reluctance among traders as the price hovers around August’s bar. Note that the MACD has reached its ceiling from July and April.

    Still, with the RSI hanging comfortably above its 50 neutral mark and the 20-day EMA set to cross above the 50-day EMA, buying appetite may not entirely disappear. In this case, the pair may again attempt to stretch towards the 150.75-151.55 border. The 50% Fibonacci retracement of the July-September downtrend and the crucial support-turned-resistance line from the 2023 bottom are in that price neighborhood. Hence, a breach of that wall could excite buyers, speeding up the recovery process towards the 61.8% Fibonacci mark of 153.40 and the 154.00 barrier. Another success there could trigger a faster rally towards the 157.00 round level.

    Should the bears take charge immediately, the 38.2% Fibonacci of 148.11 may provide some protection ahead of the 20- and 50-day SMAs at 147.00. A move lower could stall within the 144.85-145.60 territory formed by the 23.6% Fibonacci and the ascending line from July. If selling forces persist, they could forcefully press the price towards the 141.60 base.

    In brief, USDJPY is trading near a decisive territory that could determine its next direction. For a bullish trend reversal, the pair must close above August’s bar of 149.40 and more importantly sustain buying interest above 151.55.

    Source by: XM Global

    Share. Facebook Twitter Pinterest LinkedIn Telegram WhatsApp Copy Link
    Previous ArticleTechnical Analysis – NZDUSD opens the way for more losses
    Next Article Technical Analysis – Gold’s another bullish attempt is in place

    Related Posts

    Technical Analysis

    Technical Analysis – USDJPY tests 158.00 level for first time in five months

    December 27, 2024
    Gold

    Technical Analysis – Gold returns above uptrend line

    December 23, 2024
    Technical Analysis

    Technical Analysis – USDCHF bulls are back and want to stay

    December 13, 2024
    Top Posts

    Get a Free Xmaster Formula Indicator Forex for MT4

    July 30, 2024102 Views

    Technical Analysis – ETHUSD trades flat after ETF debut

    July 25, 202446 Views

    Traders Dynamic Index (TDI): Best Strategies and Settings

    August 16, 202438 Views
    Stay In Touch
    • Facebook
    • YouTube
    • TikTok
    • WhatsApp
    • Twitter
    • Instagram

    Subscribe to Updates

    Get the latest tech news from FooBar about tech, design and biz.

    Most Popular

    Get a Free Xmaster Formula Indicator Forex for MT4

    July 30, 2024102 Views

    Technical Analysis – ETHUSD trades flat after ETF debut

    July 25, 202446 Views

    Traders Dynamic Index (TDI): Best Strategies and Settings

    August 16, 202438 Views
    Our Picks

    Technical Analysis – USDJPY tests 158.00 level for first time in five months

    December 27, 2024

    Daily Comment – Soft PCE inflation keeps rate cut hopes alive, but markets stay cautious

    December 23, 2024

    Technical Analysis – Gold returns above uptrend line

    December 23, 2024

    Subscribe to Updates

    Get the latest creative news from FooBar about art, design and business.

    Please enable JavaScript in your browser to complete this form.
    Loading
    © 2025 MyForexView.
    • Home
    • Analysis
    • Economic Calendar

    Type above and press Enter to search. Press Esc to cancel.