Close Menu
My Forex View

    Subscribe to Updates

    Get the latest creative news from FooBar about art, design and business.

    Please enable JavaScript in your browser to complete this form.
    Loading
    What's Hot

    Technical Analysis – USDJPY tests 158.00 level for first time in five months

    December 27, 2024

    Daily Comment – Soft PCE inflation keeps rate cut hopes alive, but markets stay cautious

    December 23, 2024

    Technical Analysis – Gold returns above uptrend line

    December 23, 2024
    Facebook X (Twitter) Instagram
    • Live Market
    • Learn Forex Trading
    • Technical Analysis
    Facebook X (Twitter) Instagram Pinterest Vimeo
    My Forex ViewMy Forex View
    • Home
    • Live Market
      • GBPUSD
      • EURUSD
      • USDJPY
      • XAUUSD
      • All Currency Pair
      • All Commodities Pair
    • Analysis
    • Free Forex Signals
    • Education
    • Tools
      • Economic Calendar
      • Currency Converter
      • Risk of Ruin Calculator
      • Pivot Points Calculator
      • Crypto Exchange Fees Calculator
      • Fibonacci Calculator
      • Forex Rebates
      • Margin Calculator
      • Compounding Calculator
      • Profit Calculator
      • Pip Calculator
      • Lot Size Calculator
      • Drawdown Calculator
    • Blog
    Join Telegram
    My Forex View
    Home » Technical Analysis – USDJPY outlook remains gloomy
    Technical Analysis

    Technical Analysis – USDJPY outlook remains gloomy

    Christina ParthenidouBy Christina ParthenidouOctober 2, 2024Updated:November 7, 2024No Comments2 Mins Read
    Facebook Twitter LinkedIn Pinterest Email
    • USDJPY holds below key resistance levels as October’s session starts
    • Technical signals cannot warrant a bullish trend reversal

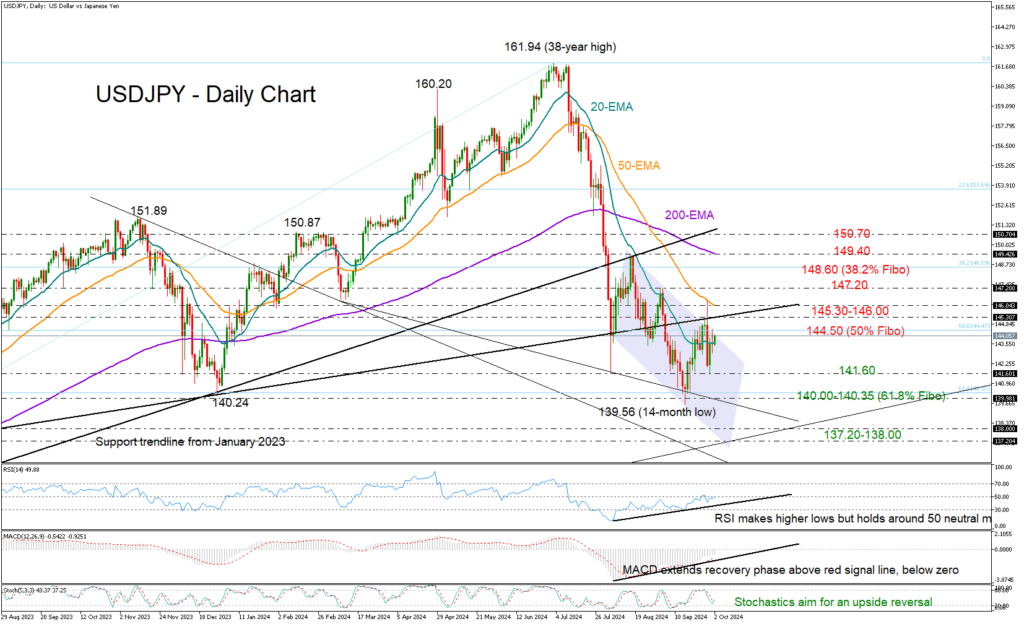
    USDJPY had a lackluster beginning to October, with a neutral close around its 20-day EMA and previously a rejection near the 50% Fibonacci retracement of the 2023-2024 upleg at 144.50.

    Currently, the pair is attempting to reach the 144.50 territory again, but there may be more hurdles to overcome. Another challenge could emerge somewhere between the broken support trendline at 145.30 and the 50-day EMA at 146.00, while higher, the bulls may face a wall near September’s high of 147.20. If the latter proves easy to overcome, the spotlight might next shift to the 38.2% Fibonacci mark of 148.60 and then towards the 200-day EMA at 149.40.

    Should the bears take control once more and push the price below its 20-day EMA at 143.60, there is a possibility of a new downward movement towards the 141.60 floor. Breaking lower, the pair could initially seek shelter around the critical 61.8% Fibonacci area of 140.35 and the 140.00 psychological mark. A failure to bounce back may result in a significant sell-off towards the 137.20-138.00 area, which was last seen in July 2023.  

    While trend signals are stagnant, there is encouraging movement in technical indicators like the RSI and MACD, indicating bullish divergence. Yet, an imminent upside reversal in the price cannot be warranted as long as the RSI is still around its 50 neutral mark and the latter is hovering below zero.

    Overall, the short-term outlook for USDJPY is not favorable. For the pair to resume its previous upward trajectory, it must successfully climb sustainably above 150.70. On the downside, a close below 140.00 could further worsen the bearish trend.

    Source by: XM Global

    Share. Facebook Twitter Pinterest LinkedIn Telegram WhatsApp Copy Link
    Previous ArticleTechnical Analysis – GBPUSD slips near strong support of 1.3265
    Next Article Technical Analysis – Gold action within narrow range

    Related Posts

    Technical Analysis

    Technical Analysis – USDJPY tests 158.00 level for first time in five months

    December 27, 2024
    Gold

    Technical Analysis – Gold returns above uptrend line

    December 23, 2024
    Technical Analysis

    Technical Analysis – USDCHF bulls are back and want to stay

    December 13, 2024
    Top Posts

    Get a Free Xmaster Formula Indicator Forex for MT4

    July 30, 2024102 Views

    Technical Analysis – ETHUSD trades flat after ETF debut

    July 25, 202446 Views

    Traders Dynamic Index (TDI): Best Strategies and Settings

    August 16, 202438 Views
    Stay In Touch
    • Facebook
    • YouTube
    • TikTok
    • WhatsApp
    • Twitter
    • Instagram

    Subscribe to Updates

    Get the latest tech news from FooBar about tech, design and biz.

    Most Popular

    Get a Free Xmaster Formula Indicator Forex for MT4

    July 30, 2024102 Views

    Technical Analysis – ETHUSD trades flat after ETF debut

    July 25, 202446 Views

    Traders Dynamic Index (TDI): Best Strategies and Settings

    August 16, 202438 Views
    Our Picks

    Technical Analysis – USDJPY tests 158.00 level for first time in five months

    December 27, 2024

    Daily Comment – Soft PCE inflation keeps rate cut hopes alive, but markets stay cautious

    December 23, 2024

    Technical Analysis – Gold returns above uptrend line

    December 23, 2024

    Subscribe to Updates

    Get the latest creative news from FooBar about art, design and business.

    Please enable JavaScript in your browser to complete this form.
    Loading
    © 2025 MyForexView.
    • Home
    • Analysis
    • Economic Calendar

    Type above and press Enter to search. Press Esc to cancel.