Close Menu
My Forex View

    Subscribe to Updates

    Get the latest creative news from FooBar about art, design and business.

    Please enable JavaScript in your browser to complete this form.
    Loading
    What's Hot

    Technical Analysis – USDJPY tests 158.00 level for first time in five months

    December 27, 2024

    Daily Comment – Soft PCE inflation keeps rate cut hopes alive, but markets stay cautious

    December 23, 2024

    Technical Analysis – Gold returns above uptrend line

    December 23, 2024
    Facebook X (Twitter) Instagram
    • Live Market
    • Learn Forex Trading
    • Technical Analysis
    Facebook X (Twitter) Instagram Pinterest Vimeo
    My Forex ViewMy Forex View
    • Home
    • Live Market
      • GBPUSD
      • EURUSD
      • USDJPY
      • XAUUSD
      • All Currency Pair
      • All Commodities Pair
    • Analysis
    • Free Forex Signals
    • Education
    • Tools
      • Economic Calendar
      • Currency Converter
      • Risk of Ruin Calculator
      • Pivot Points Calculator
      • Crypto Exchange Fees Calculator
      • Fibonacci Calculator
      • Forex Rebates
      • Margin Calculator
      • Compounding Calculator
      • Profit Calculator
      • Pip Calculator
      • Lot Size Calculator
      • Drawdown Calculator
    • Blog
    Join Telegram
    My Forex View
    Home » Technical Analysis – USDJPY poised for a bullish trend reversal
    Technical Analysis

    Technical Analysis – USDJPY poised for a bullish trend reversal

    Christina ParthenidouBy Christina ParthenidouOctober 22, 2024Updated:November 7, 2024No Comments2 Mins Read
    Facebook Twitter LinkedIn Pinterest Email
    • USDJPY jumps back into the 150 area after two months
    • Caution needed due to overbought conditions

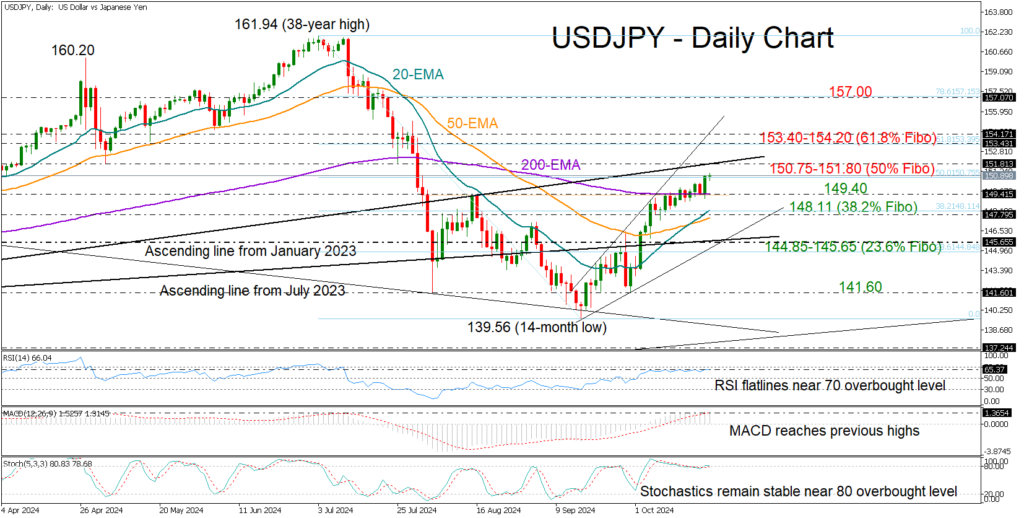
    USDJPY kicked off the week on a strong note, rising at a faster pace to close above the 150.00 mark for the first time since August. The pickup in the price confirms a bullish breakout above the August high of 149.40 and the 200-day exponential moving average (EMA). Now, all eyes are on the important trendline, which has shifted from support to resistance, sitting at 151.80—this level previously led to a dip to a 14-month low.

    That said, it’s worth noting that technical indicators are raising some red flags. The Relative Strength Index (RSI) and the stochastic oscillator are flatlining near their overbought levels. Note that the 50% Fibonacci retracement of the July-September downtrend is currently keeping the bulls in control around the 150.75 level.

    In trend signals, the recent crossover between the 20-day and 50-day EMAs is instilling a sense of optimism, suggesting any pullbacks might be short-lived.

    If buyers step in and push above the 151.80 resistance, the next area of resistance might develop between 153.40 and 154.20, which aligns with the 61.8% Fibonacci level. A sustained move higher could peak near the 157.00 level.

    On the flip side, a pullback might initially retest the 200-day EMA at 149.40. If this base breaks this time, the 20-day and 50-day EMAs may come to the rescue near the 38.2% Fibonacci level at 148.11. Any further declines could lead the price toward the 144.85-145.65 range.

    In summary, while USDJPY bulls have shown impressive strength lately, there are signs of exhaustion in the short term. A slight correction in the bullish trend seems likely before we see new higher highs.

    Source by: XM Global

    Share. Facebook Twitter Pinterest LinkedIn Telegram WhatsApp Copy Link
    Previous ArticleDaily Comment – Gold and dollar edge up as markets bet on Trump win
    Next Article Technical Analysis – EURJPY slightly bullish ahead of key obstacles

    Related Posts

    Technical Analysis

    Technical Analysis – USDJPY tests 158.00 level for first time in five months

    December 27, 2024
    Gold

    Technical Analysis – Gold returns above uptrend line

    December 23, 2024
    Technical Analysis

    Technical Analysis – USDCHF bulls are back and want to stay

    December 13, 2024
    Top Posts

    Get a Free Xmaster Formula Indicator Forex for MT4

    July 30, 2024102 Views

    Technical Analysis – ETHUSD trades flat after ETF debut

    July 25, 202446 Views

    Traders Dynamic Index (TDI): Best Strategies and Settings

    August 16, 202435 Views
    Stay In Touch
    • Facebook
    • YouTube
    • TikTok
    • WhatsApp
    • Twitter
    • Instagram

    Subscribe to Updates

    Get the latest tech news from FooBar about tech, design and biz.

    Most Popular

    Get a Free Xmaster Formula Indicator Forex for MT4

    July 30, 2024102 Views

    Technical Analysis – ETHUSD trades flat after ETF debut

    July 25, 202446 Views

    Traders Dynamic Index (TDI): Best Strategies and Settings

    August 16, 202435 Views
    Our Picks

    Technical Analysis – USDJPY tests 158.00 level for first time in five months

    December 27, 2024

    Daily Comment – Soft PCE inflation keeps rate cut hopes alive, but markets stay cautious

    December 23, 2024

    Technical Analysis – Gold returns above uptrend line

    December 23, 2024

    Subscribe to Updates

    Get the latest creative news from FooBar about art, design and business.

    Please enable JavaScript in your browser to complete this form.
    Loading
    © 2025 MyForexView.
    • Home
    • Analysis
    • Economic Calendar

    Type above and press Enter to search. Press Esc to cancel.