Close Menu
My Forex View

    Subscribe to Updates

    Get the latest creative news from FooBar about art, design and business.

    Please enable JavaScript in your browser to complete this form.
    Loading
    What's Hot

    Technical Analysis – USDJPY tests 158.00 level for first time in five months

    December 27, 2024

    Daily Comment – Soft PCE inflation keeps rate cut hopes alive, but markets stay cautious

    December 23, 2024

    Technical Analysis – Gold returns above uptrend line

    December 23, 2024
    Facebook X (Twitter) Instagram
    • Live Market
    • Learn Forex Trading
    • Technical Analysis
    Facebook X (Twitter) Instagram Pinterest Vimeo
    My Forex ViewMy Forex View
    • Home
    • Live Market
      • GBPUSD
      • EURUSD
      • USDJPY
      • XAUUSD
      • All Currency Pair
      • All Commodities Pair
    • Analysis
    • Free Forex Signals
    • Education
    • Tools
      • Economic Calendar
      • Currency Converter
      • Risk of Ruin Calculator
      • Pivot Points Calculator
      • Crypto Exchange Fees Calculator
      • Fibonacci Calculator
      • Forex Rebates
      • Margin Calculator
      • Compounding Calculator
      • Profit Calculator
      • Pip Calculator
      • Lot Size Calculator
      • Drawdown Calculator
    • Blog
    Join Telegram
    My Forex View
    Home » Technical Analysis – USDJPY rises but still in negative territory
    Technical Analysis

    Technical Analysis – USDJPY rises but still in negative territory

    Melina DeltasBy Melina DeltasAugust 21, 2024Updated:November 7, 2024No Comments2 Mins Read
    Facebook Twitter LinkedIn Pinterest Email
    • USDJPY remains below the 200-day SMA and the uptrend line
    • RSI ticks higher reflecting the latest move

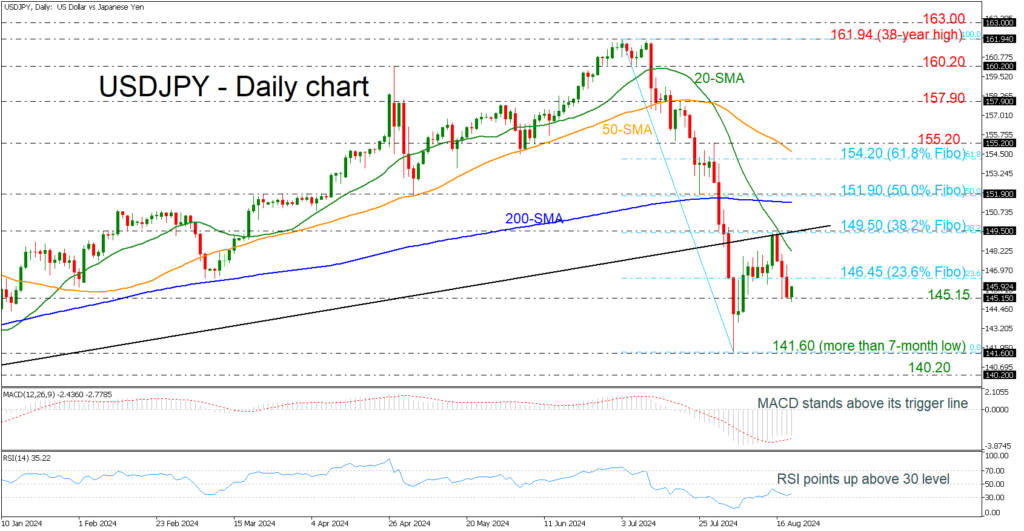
    USDJPY is gaining some ground after three consecutive red days and losing around 3% from the 149.50 resistance level. The market has been trading beneath the long-term ascending trend line since the downfall at the beginning of August and more importantly is holding below the 200-day simple moving average (SMA).

    Switching to technical oscillators, the MACD is holding in the negative region but rose above its trigger line, while the RSI is pointing upwards, mirroring the latest upside move.

    If the market overcomes the 23.6% Fibonacci retracement level of the down leg from 161.94 to 141.60 at 146.45 then may find first resistance at the 20-day SMA currently at 148.20 before challenging the previous peak at the 38.2% Fibonacci of 149.50.

    Alternatively, a drop below the 145.15 immediate support could drive traders until the more-than-seven-month low of 141.60 and the 140.20 trough, achieved on December 28.

    To summarise, USDJPY has been demonstrating a descending movement, especially after the break of the 200-day SMA, and only a climb above the 61.8% Fibonacci mark of 154.20 could change the outlook back to a positive one.

    Source by: XM Global

    Share. Facebook Twitter Pinterest LinkedIn Telegram WhatsApp Copy Link
    Previous ArticleTechnical Analysis – EURJPY’s rebound falters ahead of 200-SMA
    Next Article Technical Analysis – NZDUSD hits fresh 2-month high

    Related Posts

    Technical Analysis

    Technical Analysis – USDJPY tests 158.00 level for first time in five months

    December 27, 2024
    Gold

    Technical Analysis – Gold returns above uptrend line

    December 23, 2024
    Technical Analysis

    Technical Analysis – USDCHF bulls are back and want to stay

    December 13, 2024
    Top Posts

    Get a Free Xmaster Formula Indicator Forex for MT4

    July 30, 2024102 Views

    Technical Analysis – ETHUSD trades flat after ETF debut

    July 25, 202446 Views

    Traders Dynamic Index (TDI): Best Strategies and Settings

    August 16, 202438 Views
    Stay In Touch
    • Facebook
    • YouTube
    • TikTok
    • WhatsApp
    • Twitter
    • Instagram

    Subscribe to Updates

    Get the latest tech news from FooBar about tech, design and biz.

    Most Popular

    Get a Free Xmaster Formula Indicator Forex for MT4

    July 30, 2024102 Views

    Technical Analysis – ETHUSD trades flat after ETF debut

    July 25, 202446 Views

    Traders Dynamic Index (TDI): Best Strategies and Settings

    August 16, 202438 Views
    Our Picks

    Technical Analysis – USDJPY tests 158.00 level for first time in five months

    December 27, 2024

    Daily Comment – Soft PCE inflation keeps rate cut hopes alive, but markets stay cautious

    December 23, 2024

    Technical Analysis – Gold returns above uptrend line

    December 23, 2024

    Subscribe to Updates

    Get the latest creative news from FooBar about art, design and business.

    Please enable JavaScript in your browser to complete this form.
    Loading
    © 2025 MyForexView.
    • Home
    • Analysis
    • Economic Calendar

    Type above and press Enter to search. Press Esc to cancel.