Close Menu
My Forex View

    Subscribe to Updates

    Get the latest creative news from FooBar about art, design and business.

    Please enable JavaScript in your browser to complete this form.
    Loading
    What's Hot

    Technical Analysis – USDJPY tests 158.00 level for first time in five months

    December 27, 2024

    Daily Comment – Soft PCE inflation keeps rate cut hopes alive, but markets stay cautious

    December 23, 2024

    Technical Analysis – Gold returns above uptrend line

    December 23, 2024
    Facebook X (Twitter) Instagram
    • Live Market
    • Learn Forex Trading
    • Technical Analysis
    Facebook X (Twitter) Instagram Pinterest Vimeo
    My Forex ViewMy Forex View
    • Home
    • Live Market
      • GBPUSD
      • EURUSD
      • USDJPY
      • XAUUSD
      • All Currency Pair
      • All Commodities Pair
    • Analysis
    • Free Forex Signals
    • Education
    • Tools
      • Economic Calendar
      • Currency Converter
      • Risk of Ruin Calculator
      • Pivot Points Calculator
      • Crypto Exchange Fees Calculator
      • Fibonacci Calculator
      • Forex Rebates
      • Margin Calculator
      • Compounding Calculator
      • Profit Calculator
      • Pip Calculator
      • Lot Size Calculator
      • Drawdown Calculator
    • Blog
    Join Telegram
    My Forex View
    Home » Technical Analysis – USDJPY tests 158.00 level for first time in five months
    Technical Analysis

    Technical Analysis – USDJPY tests 158.00 level for first time in five months

    Raffi BoyadjianBy Raffi BoyadjianDecember 27, 2024No Comments2 Mins Read
    Facebook Twitter LinkedIn Pinterest Email
    • USDJPY extends uptrend to 5-month highs, reaches 158.00
    • But positive momentum may be waning

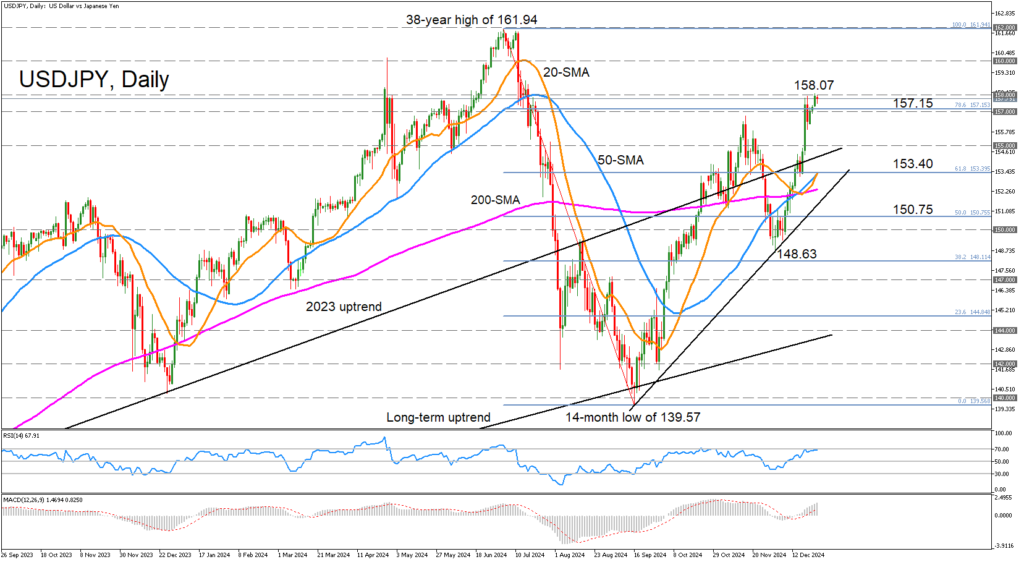
    USDJPY crossed above the 158.00 mark on Thursday for the first time since July, but the price is trading slightly below that significant level on Friday. The RSI is reflecting the weaker upside momentum as it appears to be plateauing just below the 70 overbought area. But the MACD continues to climb higher and remains well above its red signal line.

    The bulls would need to successfully overcome the resistance in the 158.00 region if the upside momentum is to strengthen or even last. A break above it would bring into focus the psychologically important 160.00 milestone, and an even more crucial level awaits at 162.00, where prices failed to breach it in early July. Nevertheless, rising above 162.00 would reinforce the pair’s long-term bullish outlook.

    However, if the 158.00 resistance proves difficult to crack and the price reverses lower, there’s likely to be immediate support around the 78.6% Fibonacci retracement of the July-September downtrend at 157.15. A drop below it would bring into scope the 155.00 level, which acted as strong support during May and June. Further down, the 61.8% Fibonacci is another strong obstacle for the bears as it is being fortified by the 20- and 50-day simple moving average (SMA) in the 153.40 region.

    Should the losses stretch all the way until the December low of 148.63, the bullish structure would come into question, at least in the medium term.

    In brief, USDJPY faces a potentially tough battle at 158.00 and surpassing it is essential to maintaining the current bullish phase. Failure to do so would risk shifting the medium-term picture to a more neutral one.

    Share. Facebook Twitter Pinterest LinkedIn Telegram WhatsApp Copy Link
    Previous ArticleDaily Comment – Soft PCE inflation keeps rate cut hopes alive, but markets stay cautious

    Related Posts

    Gold

    Technical Analysis – Gold returns above uptrend line

    December 23, 2024
    Technical Analysis

    Technical Analysis – USDCHF bulls are back and want to stay

    December 13, 2024
    NZDUSD

    Technical Analysis – NZDUSD dives to 26-month low

    December 13, 2024
    Top Posts

    Get a Free Xmaster Formula Indicator Forex for MT4

    July 30, 2024102 Views

    Technical Analysis – ETHUSD trades flat after ETF debut

    July 25, 202446 Views

    Traders Dynamic Index (TDI): Best Strategies and Settings

    August 16, 202438 Views
    Stay In Touch
    • Facebook
    • YouTube
    • TikTok
    • WhatsApp
    • Twitter
    • Instagram

    Subscribe to Updates

    Get the latest tech news from FooBar about tech, design and biz.

    Most Popular

    Get a Free Xmaster Formula Indicator Forex for MT4

    July 30, 2024102 Views

    Technical Analysis – ETHUSD trades flat after ETF debut

    July 25, 202446 Views

    Traders Dynamic Index (TDI): Best Strategies and Settings

    August 16, 202438 Views
    Our Picks

    Technical Analysis – USDJPY tests 158.00 level for first time in five months

    December 27, 2024

    Daily Comment – Soft PCE inflation keeps rate cut hopes alive, but markets stay cautious

    December 23, 2024

    Technical Analysis – Gold returns above uptrend line

    December 23, 2024

    Subscribe to Updates

    Get the latest creative news from FooBar about art, design and business.

    Please enable JavaScript in your browser to complete this form.
    Loading
    © 2025 MyForexView.
    • Home
    • Analysis
    • Economic Calendar

    Type above and press Enter to search. Press Esc to cancel.