Close Menu
My Forex View

    Subscribe to Updates

    Get the latest creative news from FooBar about art, design and business.

    Please enable JavaScript in your browser to complete this form.
    Loading
    What's Hot

    Technical Analysis – USDJPY tests 158.00 level for first time in five months

    December 27, 2024

    Daily Comment – Soft PCE inflation keeps rate cut hopes alive, but markets stay cautious

    December 23, 2024

    Technical Analysis – Gold returns above uptrend line

    December 23, 2024
    Facebook X (Twitter) Instagram
    • Live Market
    • Learn Forex Trading
    • Technical Analysis
    Facebook X (Twitter) Instagram Pinterest Vimeo
    My Forex ViewMy Forex View
    • Home
    • Live Market
      • GBPUSD
      • EURUSD
      • USDJPY
      • XAUUSD
      • All Currency Pair
      • All Commodities Pair
    • Analysis
    • Free Forex Signals
    • Education
    • Tools
      • Economic Calendar
      • Currency Converter
      • Risk of Ruin Calculator
      • Pivot Points Calculator
      • Crypto Exchange Fees Calculator
      • Fibonacci Calculator
      • Forex Rebates
      • Margin Calculator
      • Compounding Calculator
      • Profit Calculator
      • Pip Calculator
      • Lot Size Calculator
      • Drawdown Calculator
    • Blog
    Join Telegram
    My Forex View
    Home » Technical Analysis – Will the AUDUSD rally pause prove temporary?
    AUDUSD

    Technical Analysis – Will the AUDUSD rally pause prove temporary?

    Achilleas GeorgolopoulosBy Achilleas GeorgolopoulosSeptember 27, 2024Updated:November 7, 2024No Comments2 Mins Read
    Facebook Twitter LinkedIn Pinterest Email
    • AUDUSD continues to experience high volatility
    • It tests the resistance set by a long-term trendline
    • Momentum indicators send a mixed message

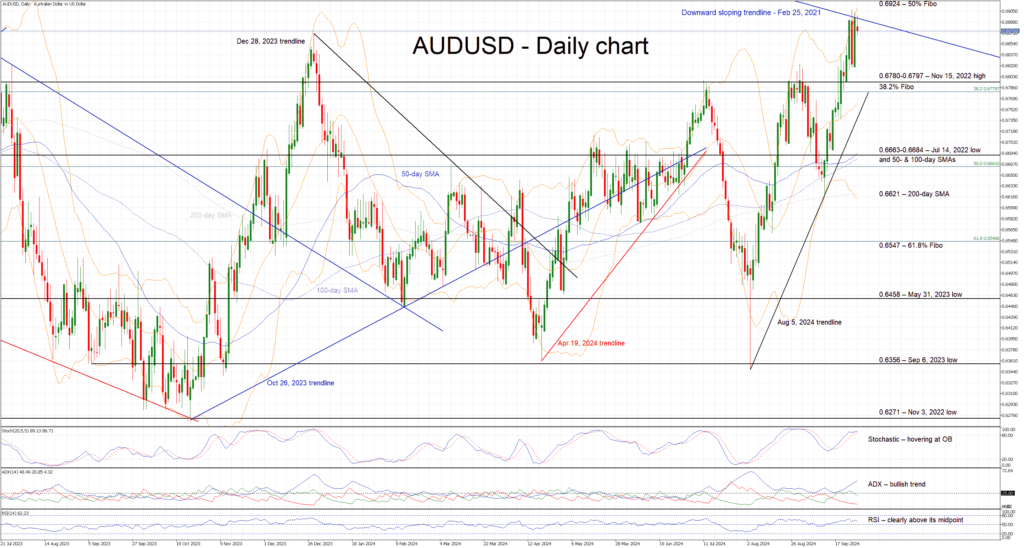
    AUDUSD is trading sideways today, following three very volatile sessions that pushed it to the highest level since February 2023. It is currently testing the resistance set by the February 25, 2021 downward sloping trendline, with today’s US PCE report potentially proving pivotal in the outcome of this battle. In the meantime, the bullish trend that started on August 5, 2024 remains firmly in place and it is supported by a series of higher highs and higher lows.

    The momentum indicators are mixed at this juncture. In more detail, the Average Directional Movement Index (ADX) is edging aggressively higher and thus signalling a strong bullish trend in AUDUSD, while the RSI is comfortably trading above its 50-midpoint. Interestingly, the stochastic oscillator is hovering inside its overbought territory, but it has failed, up to now, to record a higher high. This developing bearish divergence could threaten the prevailing bullish trend.

    Should the bulls remain confident, they could try to push AUDUSD above the February 25, 2021 trendline. If successful, they could then test the 50% Fibonacci retracement level of the October 13, 2022 – February 2, 2023 uptrend at 0.6924. Even higher, the 0.7000 level could be the next plausible target.

    On the flip side, the bears may try to regain market control by keeping AUDUSD below the February 25, 2021 trendline, and then gradually pushing it towards the busy 0.6780-0.6797 area. This is populated by the November 15, 2022 high and the 38.2% Fibonacci retracement. A break below the August 5, 2024 trendline could then open the door to a retest of the 0.6663-0.6684 region, and give bears the chance to break the recent series of higher lows.

    To sum up, AUDUSD bulls have benefited from RBA’s relative hawkishness, but another upleg needs fresh catalysts like a weak US PCE report.

    Source by: XM Global

    Share. Facebook Twitter Pinterest LinkedIn Telegram WhatsApp Copy Link
    Previous ArticleDaily Comment – Dollar bounces back as stocks lifted from more Chinese stimulus
    Next Article Technical Analysis – GBPJPY has an unstoppable rally to 2-month high

    Related Posts

    Technical Analysis

    Technical Analysis – USDJPY tests 158.00 level for first time in five months

    December 27, 2024
    Gold

    Technical Analysis – Gold returns above uptrend line

    December 23, 2024
    Technical Analysis

    Technical Analysis – USDCHF bulls are back and want to stay

    December 13, 2024
    Top Posts

    Get a Free Xmaster Formula Indicator Forex for MT4

    July 30, 2024102 Views

    Technical Analysis – ETHUSD trades flat after ETF debut

    July 25, 202446 Views

    Traders Dynamic Index (TDI): Best Strategies and Settings

    August 16, 202438 Views
    Stay In Touch
    • Facebook
    • YouTube
    • TikTok
    • WhatsApp
    • Twitter
    • Instagram

    Subscribe to Updates

    Get the latest tech news from FooBar about tech, design and biz.

    Most Popular

    Get a Free Xmaster Formula Indicator Forex for MT4

    July 30, 2024102 Views

    Technical Analysis – ETHUSD trades flat after ETF debut

    July 25, 202446 Views

    Traders Dynamic Index (TDI): Best Strategies and Settings

    August 16, 202438 Views
    Our Picks

    Technical Analysis – USDJPY tests 158.00 level for first time in five months

    December 27, 2024

    Daily Comment – Soft PCE inflation keeps rate cut hopes alive, but markets stay cautious

    December 23, 2024

    Technical Analysis – Gold returns above uptrend line

    December 23, 2024

    Subscribe to Updates

    Get the latest creative news from FooBar about art, design and business.

    Please enable JavaScript in your browser to complete this form.
    Loading
    © 2025 MyForexView.
    • Home
    • Analysis
    • Economic Calendar

    Type above and press Enter to search. Press Esc to cancel.