Close Menu
My Forex View

    Subscribe to Updates

    Get the latest creative news from FooBar about art, design and business.

    Please enable JavaScript in your browser to complete this form.
    Loading
    What's Hot

    Technical Analysis – USDJPY tests 158.00 level for first time in five months

    December 27, 2024

    Daily Comment – Soft PCE inflation keeps rate cut hopes alive, but markets stay cautious

    December 23, 2024

    Technical Analysis – Gold returns above uptrend line

    December 23, 2024
    Facebook X (Twitter) Instagram
    • Live Market
    • Learn Forex Trading
    • Technical Analysis
    Facebook X (Twitter) Instagram Pinterest Vimeo
    My Forex ViewMy Forex View
    • Home
    • Live Market
      • GBPUSD
      • EURUSD
      • USDJPY
      • XAUUSD
      • All Currency Pair
      • All Commodities Pair
    • Analysis
    • Free Forex Signals
    • Education
    • Tools
      • Economic Calendar
      • Currency Converter
      • Risk of Ruin Calculator
      • Pivot Points Calculator
      • Crypto Exchange Fees Calculator
      • Fibonacci Calculator
      • Forex Rebates
      • Margin Calculator
      • Compounding Calculator
      • Profit Calculator
      • Pip Calculator
      • Lot Size Calculator
      • Drawdown Calculator
    • Blog
    Join Telegram
    My Forex View
    Home » Technical Analysis – Will the US 30 index face more setbacks?
    Indices

    Technical Analysis – Will the US 30 index face more setbacks?

    Christina ParthenidouBy Christina ParthenidouDecember 14, 2024No Comments1 Min Read
    Facebook Twitter LinkedIn Pinterest Email
    • US 30 index extends pullback from record high
    • More selling is likely if the price closes below 43,880

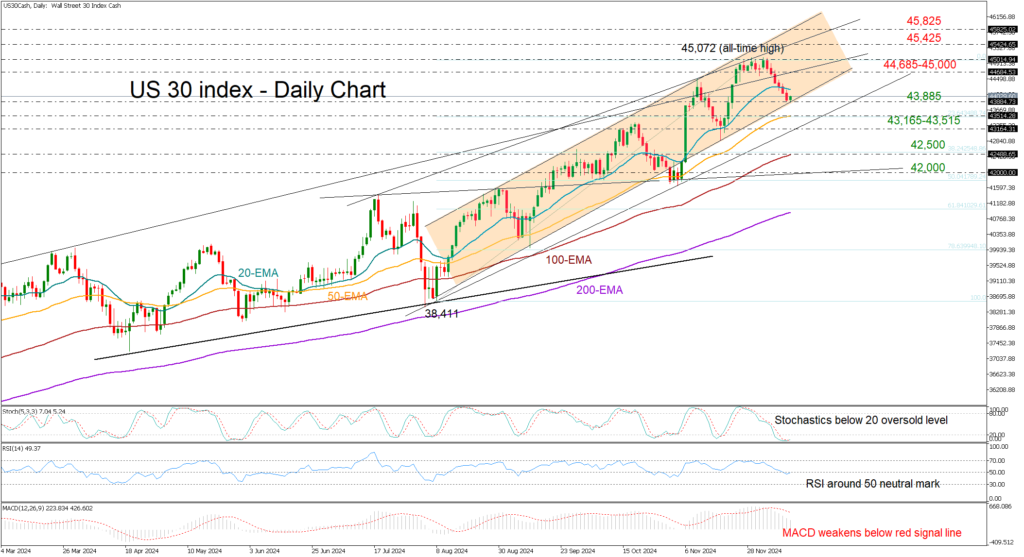
    The US 30 index (cash) has been gradually decelerating over the past week, falling from an all-time high area of 45,072 to a low of 43,872.

    The index closed below the 20-day exponential moving average (EMA), which acted as strong support in November, exposing itself to fresh declines in the coming sessions. Previously, the bulls attempted to breach the 45,072 record high twice without success. Hence, if the nearby support trendline at 43,885 cracks, the bears will head for the 50-day EMA at 43,500 and the lower band of a bullish channel seen near 43,300. Then a step lower could cause a painful decline toward the 100-day EMA at 42,500.

    In the event the bulls take control above the 20-day EMA, they may face a challenging battle within the 44,685-45,000 territory. If they win, they may print a new higher high around 45,425 or near 45,825.

    All in all, the recent downfall in the US 30 index could gain more legs in the coming sessions, particularly if the 43,885 floor collapses. 

    Share. Facebook Twitter Pinterest LinkedIn Telegram WhatsApp Copy Link
    Previous ArticleDaily Comment – Dollar continues its ascend as data clouds Fed outlook
    Next Article Technical Analysis – Gold returns above uptrend line

    Related Posts

    Indices

    Technical Analysis – US 100 index rally loses steam

    November 27, 2024
    Indices

    Technical Analysis – US 30 index skyrockets after Trump’s victory

    November 6, 2024
    Indices

    Technical Analysis – US 500 index recoups some losses in short-term

    November 5, 2024
    Top Posts

    Get a Free Xmaster Formula Indicator Forex for MT4

    July 30, 2024102 Views

    Technical Analysis – ETHUSD trades flat after ETF debut

    July 25, 202446 Views

    Traders Dynamic Index (TDI): Best Strategies and Settings

    August 16, 202438 Views
    Stay In Touch
    • Facebook
    • YouTube
    • TikTok
    • WhatsApp
    • Twitter
    • Instagram

    Subscribe to Updates

    Get the latest tech news from FooBar about tech, design and biz.

    Most Popular

    Get a Free Xmaster Formula Indicator Forex for MT4

    July 30, 2024102 Views

    Technical Analysis – ETHUSD trades flat after ETF debut

    July 25, 202446 Views

    Traders Dynamic Index (TDI): Best Strategies and Settings

    August 16, 202438 Views
    Our Picks

    Technical Analysis – USDJPY tests 158.00 level for first time in five months

    December 27, 2024

    Daily Comment – Soft PCE inflation keeps rate cut hopes alive, but markets stay cautious

    December 23, 2024

    Technical Analysis – Gold returns above uptrend line

    December 23, 2024

    Subscribe to Updates

    Get the latest creative news from FooBar about art, design and business.

    Please enable JavaScript in your browser to complete this form.
    Loading
    © 2025 MyForexView.
    • Home
    • Analysis
    • Economic Calendar

    Type above and press Enter to search. Press Esc to cancel.