")
- EURAUD edges higher, prepares to test the 50-day SMA
- Downleg since mid-August high could have run its course
- The stochastic oscillator tentatively keeps the door open for another rally

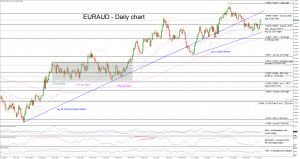
EURAUD is moving higher today, recording its fourth consecutive green candle and testing the resistance set by the 50-day simple moving average (SMA). The sell-off since the August 17, 2023 peak has failed to record a lower low, below the mid-July trough, thus opening the door to the current reaction from the bulls.
Despite the upleg, the momentum indicators are mixed at this juncture. The Average Directional Movement Index (ADX) appears uninterested in the current move as it remains stuck below its 25 threshold, and the RSI has just edged above its 50-midpoint. More importantly, the stochastic oscillator has managed to bounce off its moving average, and it is moving higher in an almost vertical fashion. This reaction is usually seen as a bullish signal.
Should the bulls still feel thirsty, they would try to overcome the 1.6696-1.6826 range that is populated by the 50-day SMA and the October 20, 2022 high. Even higher and provided that they break the August 28, 2022 ascending trendline, the bulls could set their eyes on the August 17, 2023 high at 1.7063 and potentially be given a chance to record a new 2023 high.
On the other hand, the bears are keen on retaking market control and pushing EURAUD towards the 1.6435-1.6583 range. This is a very busy area defined by the August 23, 2015 high, the 100-day SMA and the August 20, 2021 high. If successful, the bears could then have a go at testing the support set by the February 11, 2016 high and the 200-day SMA at the 1.6250 area.
To sum up, EURAUD bulls have reacted to the continued bearish pressure, but the path higher looks trickier now, especially due to the weak support from the momentum indicators.
