Close Menu
My Forex View

    Subscribe to Updates

    Get the latest creative news from FooBar about art, design and business.

    Please enable JavaScript in your browser to complete this form.
    Loading
    What's Hot

    Technical Analysis – USDJPY tests 158.00 level for first time in five months

    December 27, 2024

    Daily Comment – Soft PCE inflation keeps rate cut hopes alive, but markets stay cautious

    December 23, 2024

    Technical Analysis – Gold returns above uptrend line

    December 23, 2024
    Facebook X (Twitter) Instagram
    • Live Market
    • Learn Forex Trading
    • Technical Analysis
    Facebook X (Twitter) Instagram Pinterest Vimeo
    My Forex ViewMy Forex View
    • Home
    • Live Market
      • GBPUSD
      • EURUSD
      • USDJPY
      • XAUUSD
      • All Currency Pair
      • All Commodities Pair
    • Analysis
    • Free Forex Signals
    • Education
    • Tools
      • Economic Calendar
      • Currency Converter
      • Risk of Ruin Calculator
      • Pivot Points Calculator
      • Crypto Exchange Fees Calculator
      • Fibonacci Calculator
      • Forex Rebates
      • Margin Calculator
      • Compounding Calculator
      • Profit Calculator
      • Pip Calculator
      • Lot Size Calculator
      • Drawdown Calculator
    • Blog
    Join Telegram
    My Forex View
    Home » Technical Analysis – AUDUSD unlocks new 8-month high above 0.6800
    AUDUSD

    Technical Analysis – AUDUSD unlocks new 8-month high above 0.6800

    Melina DeltasBy Melina DeltasAugust 29, 2024Updated:November 7, 2024No Comments1 Min Read
    Facebook Twitter LinkedIn Pinterest Email
    • AUDUSD increases 7% in August
    • 20- and 50-day SMAs post bullish cross
    • Stochastic in overbought region
    • RSI still beneath 70 area

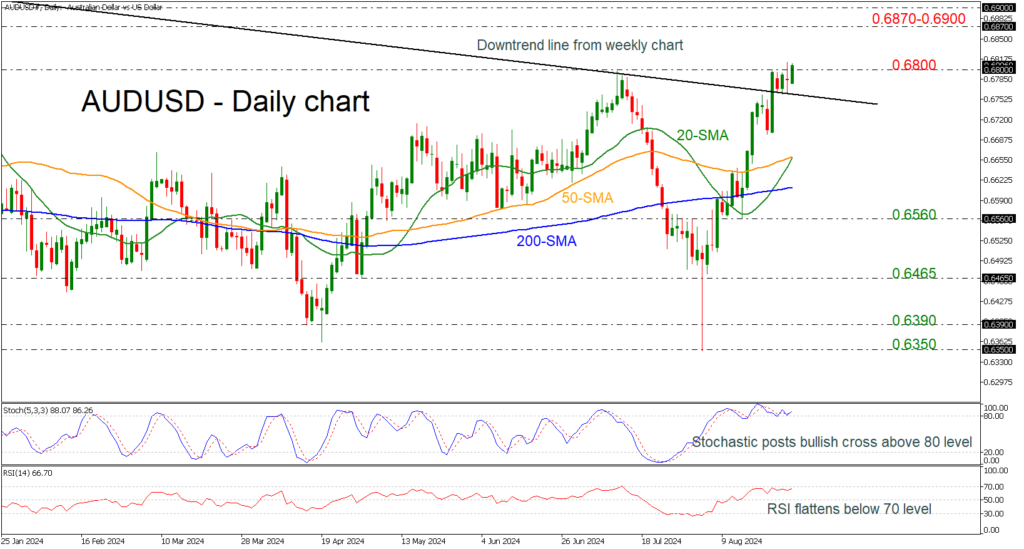
    AUDUSD hit a new eight-month high above the 0.6800 round number, breaking the long-term descending trend line to the upside. Following the bearish spike on August 5, the pair gained over 7%.

    Technically, the 20- and 50-day simple moving averages (SMAs) are ready for a bullish crossover. The stochastic oscillator is pointing north above the 80 level, whereas the RSI is moving horizontally near the 70 area.

    More advances may drive the market towards the next resistance of 0.6870, which is taken from the high on December 28. If the bulls continue to buy the pair, then the market may challenge the 0.6900 round number, achieved in July 2023.

    In the negative scenario, a drop beneath the diagonal line could indicate a retreat until the 20- and 50-day SMAs at 0.6660. Even lower, the 200-day SMA at 0.6610 could be a real struggle for traders.

    Summarizing, AUDUSD has shown a significant improvement, but only a successful rally above 0.6800 could confirm a bullish retracement.

    Source by: XM Global

    Share. Facebook Twitter Pinterest LinkedIn Telegram WhatsApp Copy Link
    Previous ArticleDaily Comment – Markets cautious as Nvidia earnings and key US data loom
    Next Article Midweek Technical Look – GBPUSD, gold, oil

    Related Posts

    Technical Analysis

    Technical Analysis – USDJPY tests 158.00 level for first time in five months

    December 27, 2024
    Gold

    Technical Analysis – Gold returns above uptrend line

    December 23, 2024
    Technical Analysis

    Technical Analysis – USDCHF bulls are back and want to stay

    December 13, 2024
    Top Posts

    Get a Free Xmaster Formula Indicator Forex for MT4

    July 30, 2024102 Views

    Technical Analysis – ETHUSD trades flat after ETF debut

    July 25, 202446 Views

    Traders Dynamic Index (TDI): Best Strategies and Settings

    August 16, 202438 Views
    Stay In Touch
    • Facebook
    • YouTube
    • TikTok
    • WhatsApp
    • Twitter
    • Instagram

    Subscribe to Updates

    Get the latest tech news from FooBar about tech, design and biz.

    Most Popular

    Get a Free Xmaster Formula Indicator Forex for MT4

    July 30, 2024102 Views

    Technical Analysis – ETHUSD trades flat after ETF debut

    July 25, 202446 Views

    Traders Dynamic Index (TDI): Best Strategies and Settings

    August 16, 202438 Views
    Our Picks

    Technical Analysis – USDJPY tests 158.00 level for first time in five months

    December 27, 2024

    Daily Comment – Soft PCE inflation keeps rate cut hopes alive, but markets stay cautious

    December 23, 2024

    Technical Analysis – Gold returns above uptrend line

    December 23, 2024

    Subscribe to Updates

    Get the latest creative news from FooBar about art, design and business.

    Please enable JavaScript in your browser to complete this form.
    Loading
    © 2025 MyForexView.
    • Home
    • Analysis
    • Economic Calendar

    Type above and press Enter to search. Press Esc to cancel.