Close Menu
My Forex View

    Subscribe to Updates

    Get the latest creative news from FooBar about art, design and business.

    Please enable JavaScript in your browser to complete this form.
    Loading
    What's Hot

    Technical Analysis – USDJPY tests 158.00 level for first time in five months

    December 27, 2024

    Daily Comment – Soft PCE inflation keeps rate cut hopes alive, but markets stay cautious

    December 23, 2024

    Technical Analysis – Gold returns above uptrend line

    December 23, 2024
    Facebook X (Twitter) Instagram
    • Live Market
    • Learn Forex Trading
    • Technical Analysis
    Facebook X (Twitter) Instagram Pinterest Vimeo
    My Forex ViewMy Forex View
    • Home
    • Live Market
      • GBPUSD
      • EURUSD
      • USDJPY
      • XAUUSD
      • All Currency Pair
      • All Commodities Pair
    • Analysis
    • Free Forex Signals
    • Education
    • Tools
      • Economic Calendar
      • Currency Converter
      • Risk of Ruin Calculator
      • Pivot Points Calculator
      • Crypto Exchange Fees Calculator
      • Fibonacci Calculator
      • Forex Rebates
      • Margin Calculator
      • Compounding Calculator
      • Profit Calculator
      • Pip Calculator
      • Lot Size Calculator
      • Drawdown Calculator
    • Blog
    Join Telegram
    My Forex View
    Home » Technical Analysis – EURCHF’s rebound faces 200-day SMA
    EURCHF

    Technical Analysis – EURCHF’s rebound faces 200-day SMA

    Stefanos OikonomidisBy Stefanos OikonomidisJuly 29, 2024Updated:November 7, 2024No Comments2 Mins Read
    Facebook Twitter LinkedIn Pinterest Email
    • EURCHF tumbles to a fresh 1-month bottom
    • But the price finds its feet at the 61.8% Fibo
    • Momentum indicators are heavily skewed to the downside

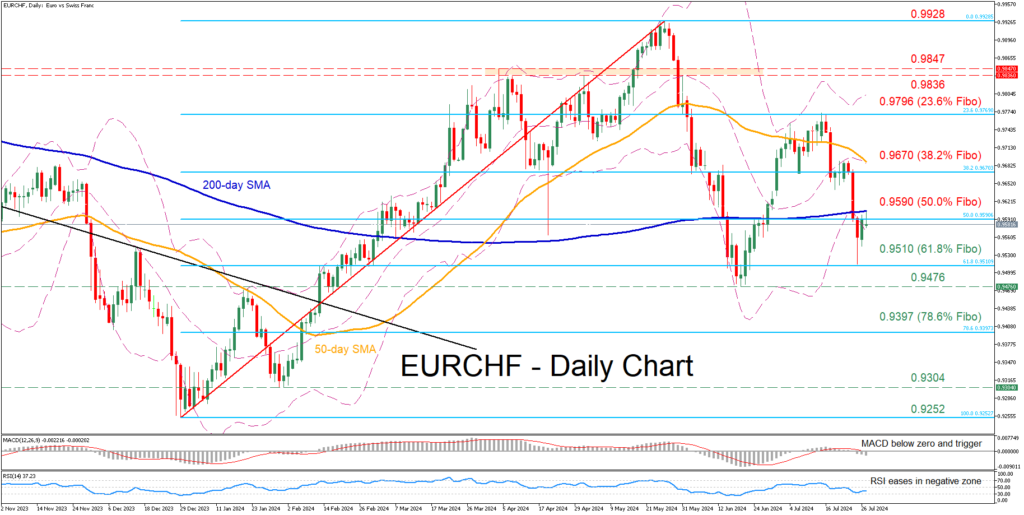
    EURCHF has been undergoing a strong pullback following its rejection around 0.9796, which is the 23.6% Fibonacci retracement of the 0.9252-0.9928 upleg. Although the pair managed to pause its retreat at the 61.8% Fibo of 0.9510, its rebound is being held down by the 200-day simple moving average (SMA).

    Should the negative bias persist, the bears could attempt to send the price below the 61.8% Fibo of 0.9510 and attack the five-month bottom of 0.9476. A break below the latter could pave the way for the 78.6% Fibo of 0.9397. Failing to halt there, the pair may challenge the January-February support of 0.9304.

    On the flipside, if the price breaks above the 50.0% Fibo of 0.9590 and 200-day SMA, the 38.2% Fibo of 0.9670 could act as the next line of defence. Further advances could then cease at the July rejection region of 0.9796, which is also the 23.6% Fibo. Even higher, the pair might meet resistance at the 0.9836-0.9847 range, defined by the May resistance zone and the April peak.

    Overall, EURCHF has been attempting a rebound from its fresh one-month low, but the 200-day SMA has been acting as a strong ceiling. Therefore, a decisive break above that crucial hurdle is needed for the bulls to regain confidence for a broader recovery.

    Source by: XM Global

    Share. Facebook Twitter Pinterest LinkedIn Telegram WhatsApp Copy Link
    Previous ArticleTechnical Analysis – Gold bounces off 50-day SMA
    Next Article Technical Analysis – US 500 index bounces off long-term uptrend line

    Related Posts

    Technical Analysis

    Technical Analysis – USDJPY tests 158.00 level for first time in five months

    December 27, 2024
    Gold

    Technical Analysis – Gold returns above uptrend line

    December 23, 2024
    Technical Analysis

    Technical Analysis – USDCHF bulls are back and want to stay

    December 13, 2024
    Top Posts

    Get a Free Xmaster Formula Indicator Forex for MT4

    July 30, 2024102 Views

    Technical Analysis – ETHUSD trades flat after ETF debut

    July 25, 202446 Views

    Traders Dynamic Index (TDI): Best Strategies and Settings

    August 16, 202436 Views
    Stay In Touch
    • Facebook
    • YouTube
    • TikTok
    • WhatsApp
    • Twitter
    • Instagram

    Subscribe to Updates

    Get the latest tech news from FooBar about tech, design and biz.

    Most Popular

    Get a Free Xmaster Formula Indicator Forex for MT4

    July 30, 2024102 Views

    Technical Analysis – ETHUSD trades flat after ETF debut

    July 25, 202446 Views

    Traders Dynamic Index (TDI): Best Strategies and Settings

    August 16, 202436 Views
    Our Picks

    Technical Analysis – USDJPY tests 158.00 level for first time in five months

    December 27, 2024

    Daily Comment – Soft PCE inflation keeps rate cut hopes alive, but markets stay cautious

    December 23, 2024

    Technical Analysis – Gold returns above uptrend line

    December 23, 2024

    Subscribe to Updates

    Get the latest creative news from FooBar about art, design and business.

    Please enable JavaScript in your browser to complete this form.
    Loading
    © 2025 MyForexView.
    • Home
    • Analysis
    • Economic Calendar

    Type above and press Enter to search. Press Esc to cancel.