Close Menu
My Forex View

    Subscribe to Updates

    Get the latest creative news from FooBar about art, design and business.

    Please enable JavaScript in your browser to complete this form.
    Loading
    What's Hot

    Technical Analysis – USDJPY tests 158.00 level for first time in five months

    December 27, 2024

    Daily Comment – Soft PCE inflation keeps rate cut hopes alive, but markets stay cautious

    December 23, 2024

    Technical Analysis – Gold returns above uptrend line

    December 23, 2024
    Facebook X (Twitter) Instagram
    • Live Market
    • Learn Forex Trading
    • Technical Analysis
    Facebook X (Twitter) Instagram Pinterest Vimeo
    My Forex ViewMy Forex View
    • Home
    • Live Market
      • GBPUSD
      • EURUSD
      • USDJPY
      • XAUUSD
      • All Currency Pair
      • All Commodities Pair
    • Analysis
    • Free Forex Signals
    • Education
    • Tools
      • Economic Calendar
      • Currency Converter
      • Risk of Ruin Calculator
      • Pivot Points Calculator
      • Crypto Exchange Fees Calculator
      • Fibonacci Calculator
      • Forex Rebates
      • Margin Calculator
      • Compounding Calculator
      • Profit Calculator
      • Pip Calculator
      • Lot Size Calculator
      • Drawdown Calculator
    • Blog
    Join Telegram
    My Forex View
    Home » Technical Analysis – Gold bulls may rest after record high
    Gold

    Technical Analysis – Gold bulls may rest after record high

    Christina ParthenidouBy Christina ParthenidouAugust 21, 2024Updated:November 7, 2024No Comments2 Mins Read
    Facebook Twitter LinkedIn Pinterest Email
    • Gold pulls below record high; might give up more ground
    • Market trend stays positive as long as price holds above 2,463

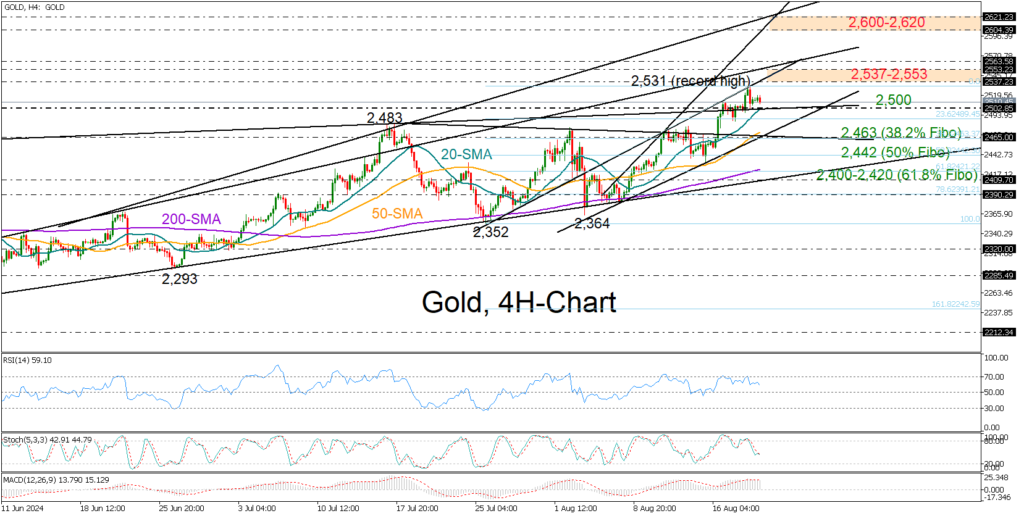
    Gold lost momentum after unlocking an all-time high of 2,531 on Tuesday near the rising constraining line drawn from July’s low, but it maintained its resilience above the 2,500 psychological number by the end of the day.

    The technical picture in the four-hour chart has started to show some cracks. The precious metal appears to have formed a bearish engulfing candlestick pattern at the peak of its upward movement, indicating a potential downward shift in the price. The indicators are beginning to trend downward, further validating the negative scenario.

    Nevertheless, the price is still in a bullish channel, so any possible drop can be seen as part of the upward pattern unless the bears break below 2,463. Meanwhile, the market could find support from the 20-period simple moving average at 2,500 and the 23.6% Fibonacci retracement of the July-August rally at 2,489.

    The 50% Fibonacci level of 2,442 could ease selling forces below the channel ahead of the 61.8% Fibonacci level of 2,420, while a step below the ascending trendline at 2,400, which has been buffering downside movements since the end of June, could send stronger bearish signals if breached.

    If the bulls stay active, their goal will be to pierce through the border between 2,537 and 2,555, with potential to continue towards the next barrier at 2,600-2,620. Slightly higher, the 2,650 region could be another hurdle.

    In short, gold could become more susceptible to downward risks in the upcoming sessions. However, the market sentiment would only be dampened if the price falls below 2,463, whilst a rebound above 2,537-2,555 could increase buying interest.

    Source by: XM Global

    Share. Facebook Twitter Pinterest LinkedIn Telegram WhatsApp Copy Link
    Previous ArticleTechnical Analysis – EURGBP tilts to the upside in near term
    Next Article Market Comment – Dollar looks at the Fed minutes for a small boost

    Related Posts

    Technical Analysis

    Technical Analysis – USDJPY tests 158.00 level for first time in five months

    December 27, 2024
    Gold

    Technical Analysis – Gold returns above uptrend line

    December 23, 2024
    Technical Analysis

    Technical Analysis – USDCHF bulls are back and want to stay

    December 13, 2024
    Top Posts

    Get a Free Xmaster Formula Indicator Forex for MT4

    July 30, 2024102 Views

    Technical Analysis – ETHUSD trades flat after ETF debut

    July 25, 202446 Views

    Traders Dynamic Index (TDI): Best Strategies and Settings

    August 16, 202435 Views
    Stay In Touch
    • Facebook
    • YouTube
    • TikTok
    • WhatsApp
    • Twitter
    • Instagram

    Subscribe to Updates

    Get the latest tech news from FooBar about tech, design and biz.

    Most Popular

    Get a Free Xmaster Formula Indicator Forex for MT4

    July 30, 2024102 Views

    Technical Analysis – ETHUSD trades flat after ETF debut

    July 25, 202446 Views

    Traders Dynamic Index (TDI): Best Strategies and Settings

    August 16, 202435 Views
    Our Picks

    Technical Analysis – USDJPY tests 158.00 level for first time in five months

    December 27, 2024

    Daily Comment – Soft PCE inflation keeps rate cut hopes alive, but markets stay cautious

    December 23, 2024

    Technical Analysis – Gold returns above uptrend line

    December 23, 2024

    Subscribe to Updates

    Get the latest creative news from FooBar about art, design and business.

    Please enable JavaScript in your browser to complete this form.
    Loading
    © 2025 MyForexView.
    • Home
    • Analysis
    • Economic Calendar

    Type above and press Enter to search. Press Esc to cancel.